
Seven tricks to win food wars on food aggregators apps
19th Aug, 2021

By Abhinav Gupta
Food aggregators have emerged as a critical channel for Quick Service Restaurant (QSR) chains to grow their business – especially post-pandemic. Quick Service Restaurants, QSRs, as we call them, are capitalizing on the opportunity too. For many chains, as high as 50% of their revenue now comes via aggregator channels.
However, most QSR chains are only beginning to leverage data and analytics to drive business on the food aggregator apps.
Currently, QSRs spend vast amounts on marketing on Food apps but are always unsure of the return on their investment. Aggregators share some data, but they have an inherent motive to entice QSRs to buy more advertisements. They cannot share competitive insights as well. Moreover, as QSRs work with several platforms at once, it gets difficult to collate and analyze data from all these platforms together. These issues make leveraging data for QSR chains difficult. At Dataweave, we have collated some insights from our recent experience of working with global QSR chains helping them improve their sales on different food applications using data:
1. Availability
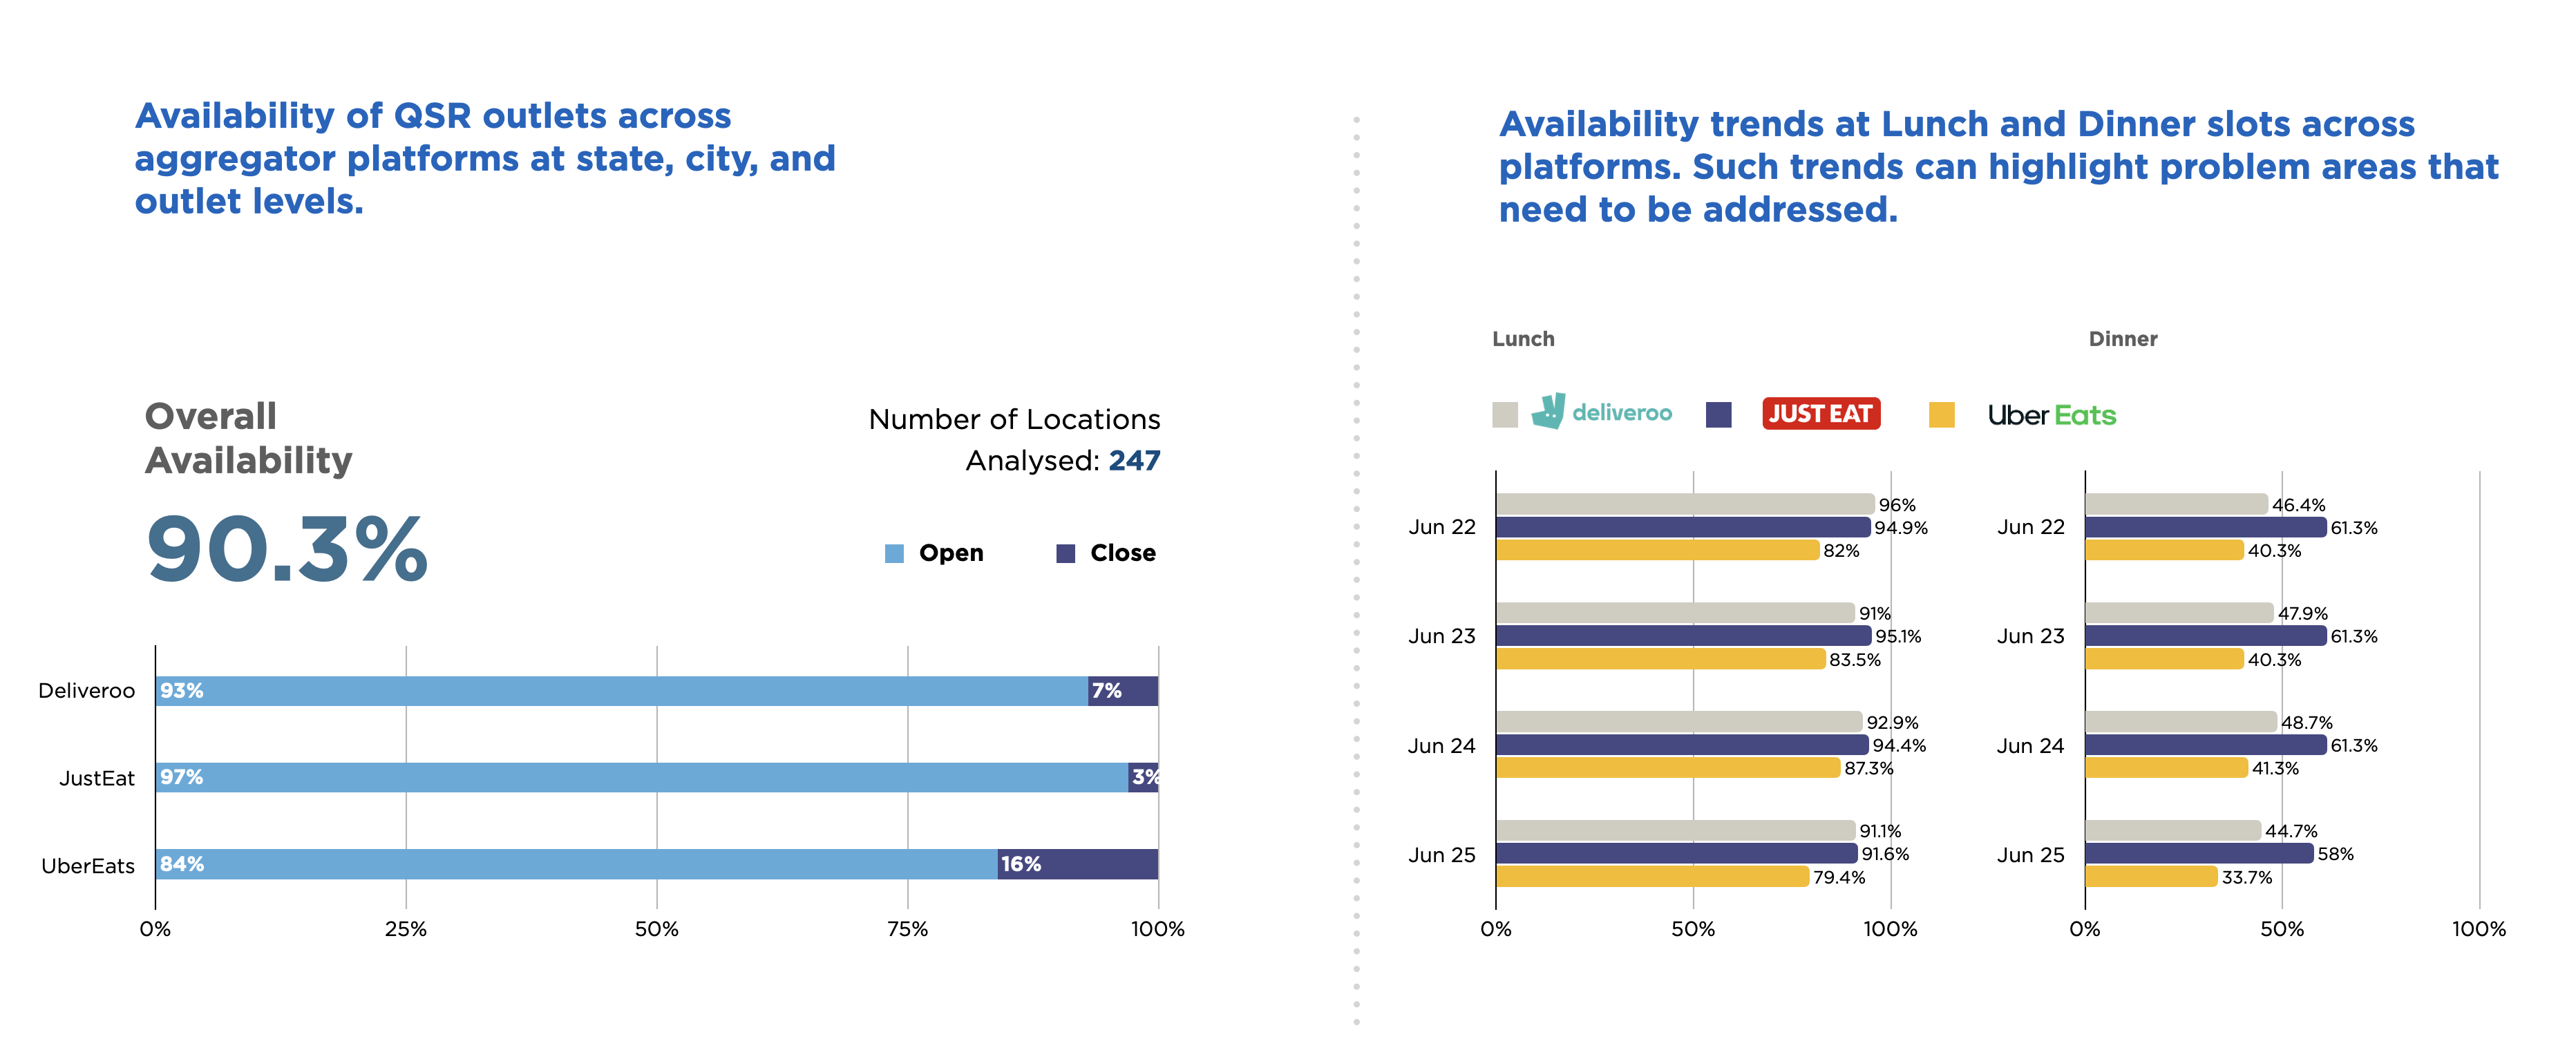
The easiest and most impactful fix is to ensure that all your outlets are available on the app at the peak slots, typically lunch and dinner. Availability increase of ~2% at peak times results in order volume increase by ~5%-7%.
The reasons for unavailability range from lack of riders, overwhelming orders at the outlet, or just plain technical glitches. Tracking this metric and actively engaging with your stores and aggregator platforms to resolve any issues should be a daily priority.
2. Monitoring Keyword Ranks
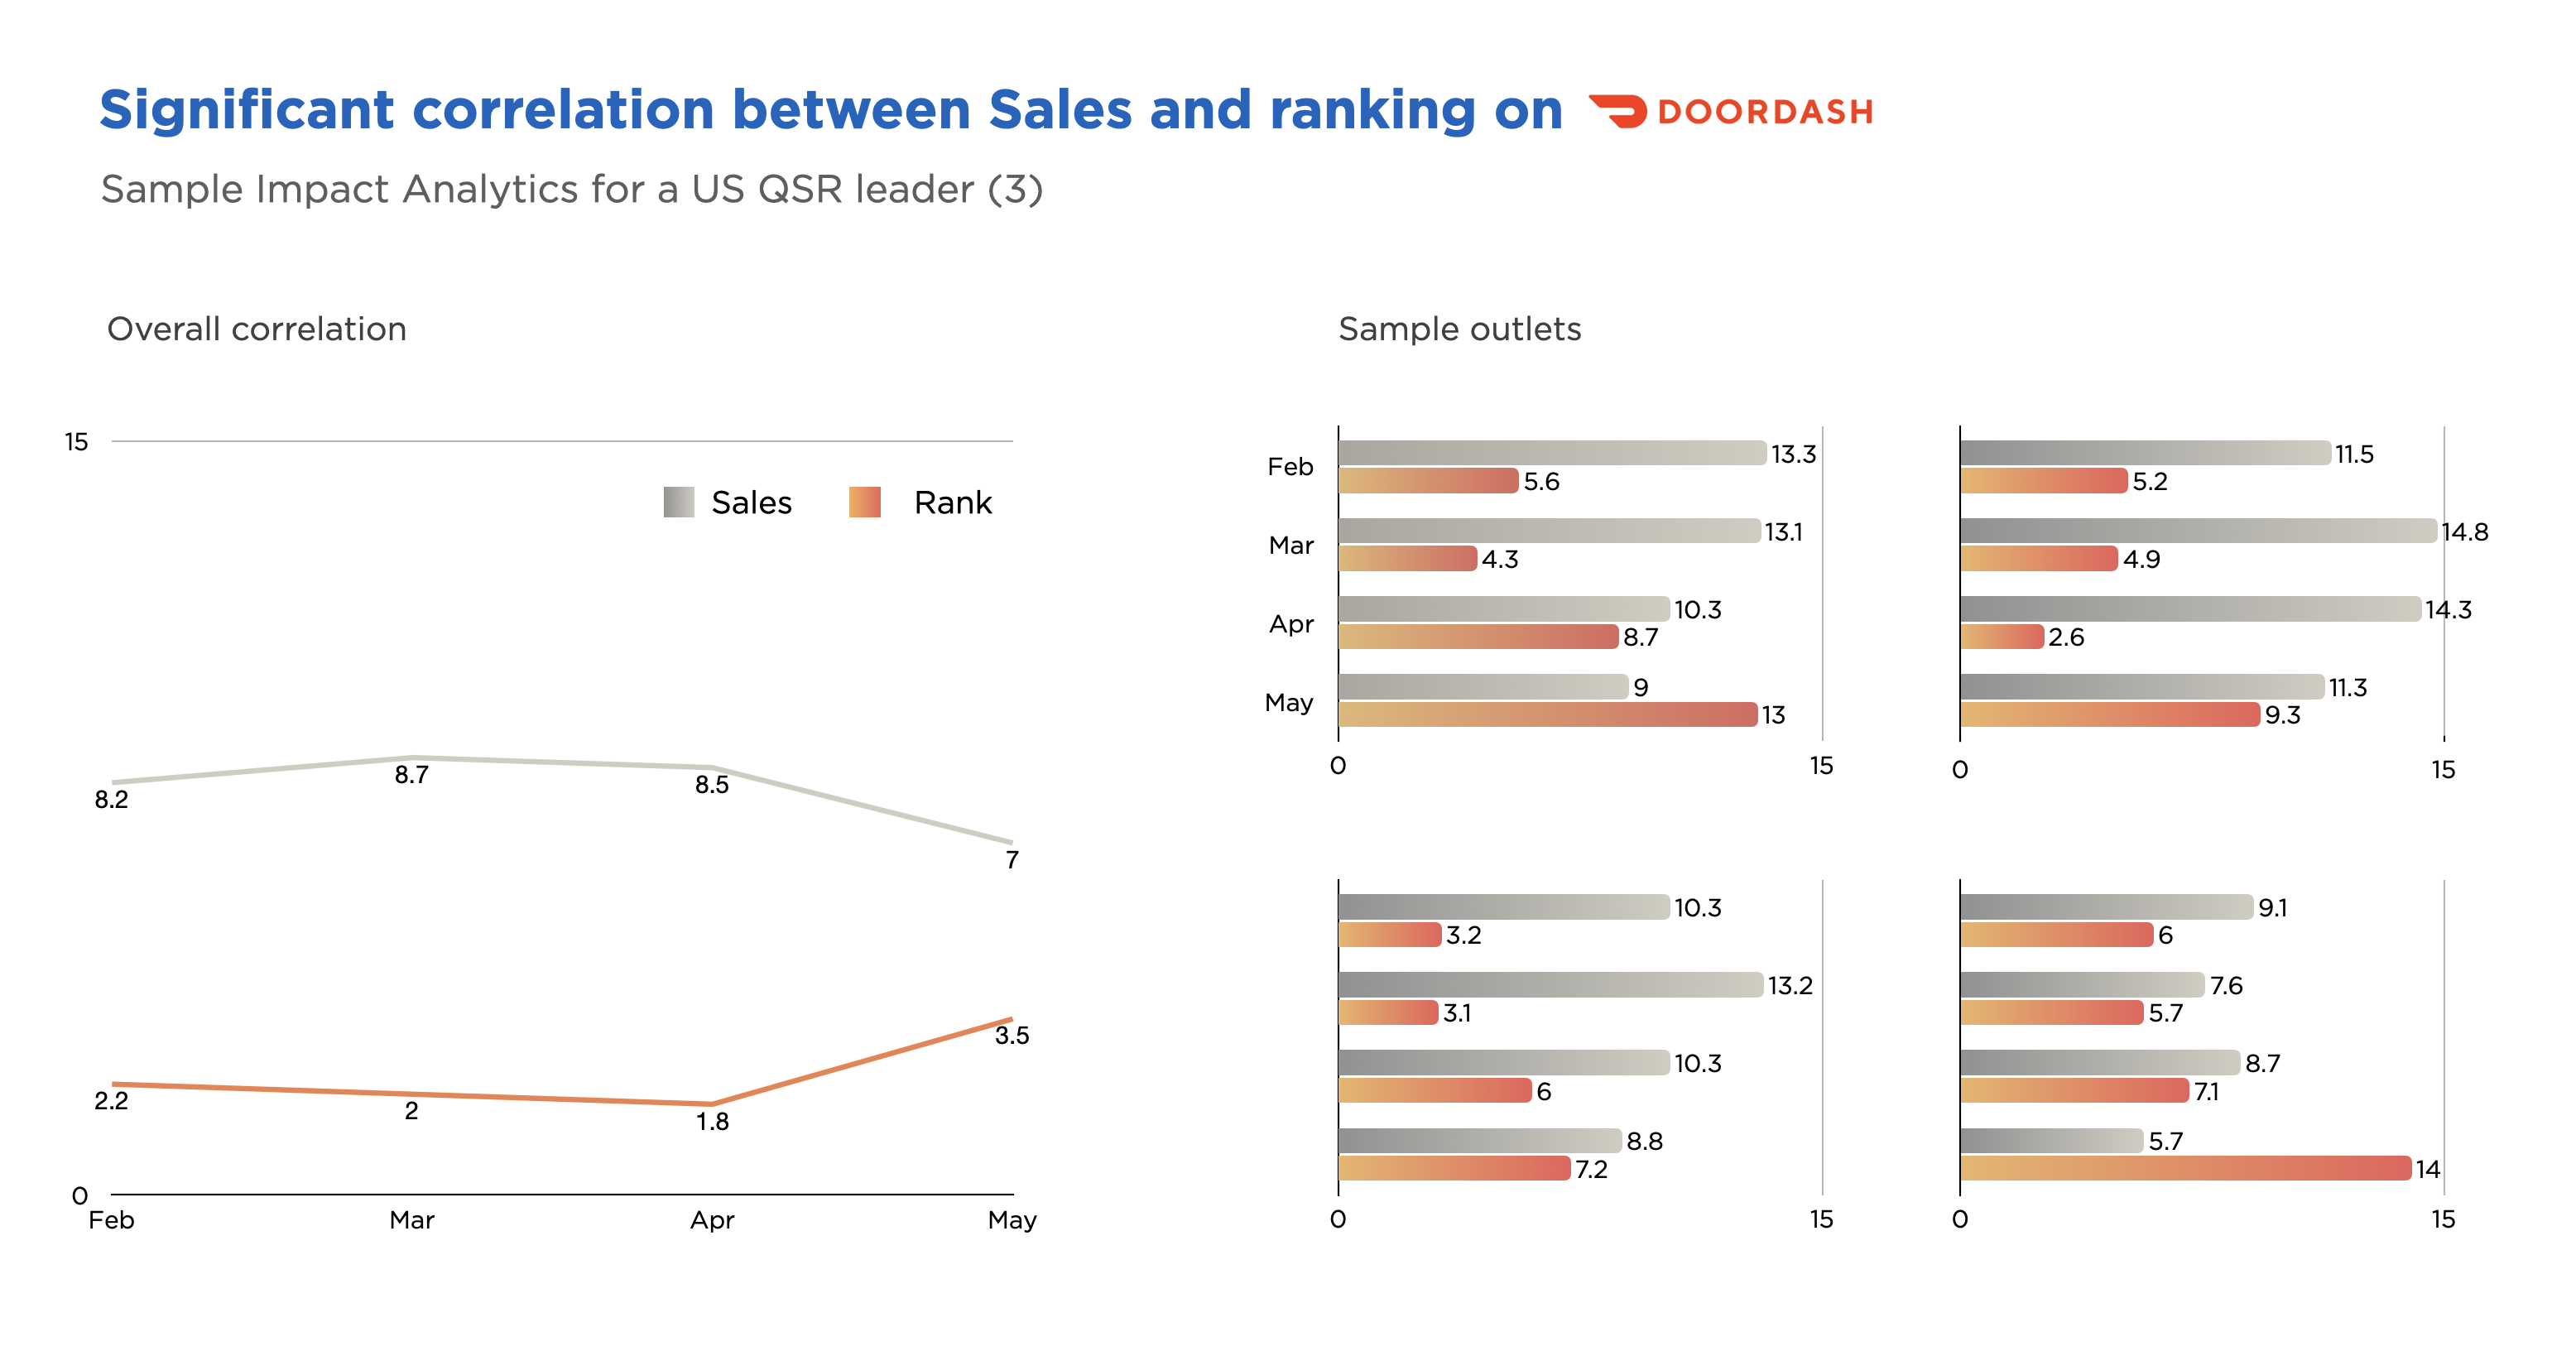
If you are a Pizza chain but don’t show up among the first five ranks when your target customer is searching for Pizza, the chances of a sale are lower.
What helps is to track the ranking for your brand, and your competitor brands, in different category listings across different keywords.
Your ranking may differ a lot by region, markets, and Zip codes depending on consumer tastes, competitors, and your brand presence, and it’s helpful to track it granularly.
No surprises here – but rank is strongly correlated with your order volumes!
3. Tracking competitors
One of the tricks to rapidly gain in ranking is to monitor competitors in your category and ensure that you are doing better on each attribute – ranking, rating, ETAs (estimated time of arrival), fees, discounts, etc.
A slight edge across your outlets translates to rapid gain in ranking and order volumes.
4. Choosing suitable banners for promotions
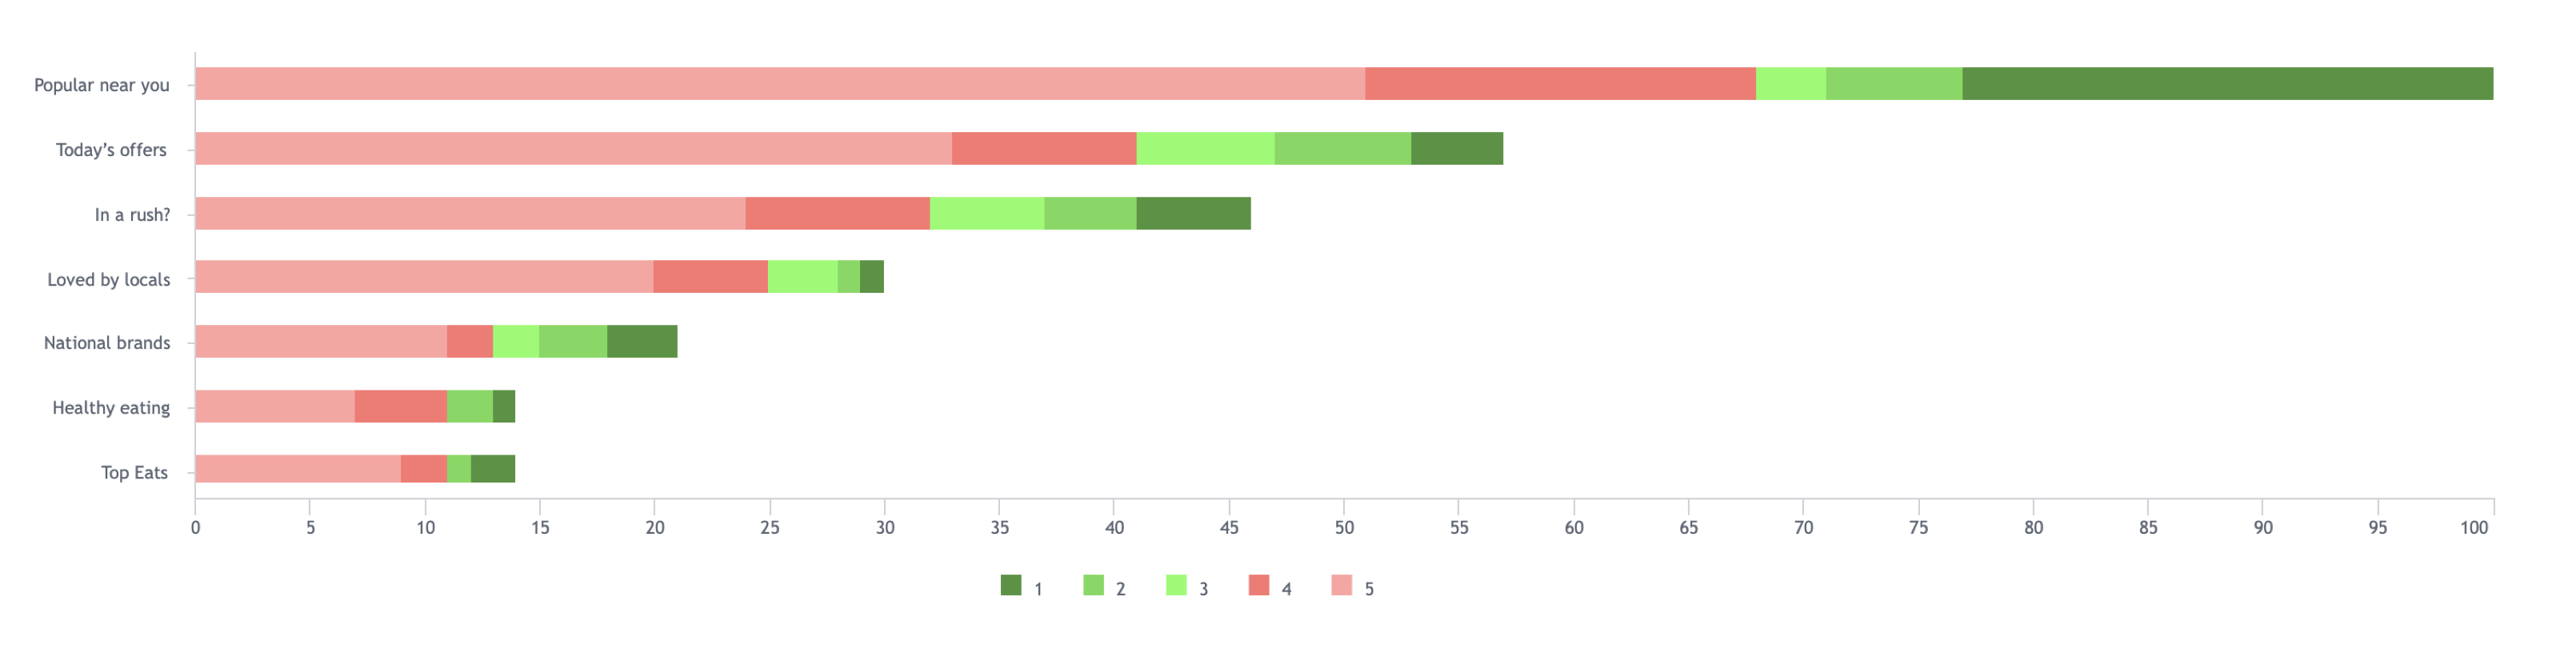
Choosing banners is an essential strategy to gain visibility – but it’s vital to know two factors:
- At what rank does the banner you are choosing show up on the App/Website.
- At what position does your brand show up in the banner?
If you are on a 5th rank on the 4th banner, your marketing spend is probably going down the drain.
5. A/B Testing
Before starting an effective marketing campaign, it helps to do A/B testing by running two different banners in the same city one week apart to see which yields more impact.
A/B testing can also be a tool to choose banners, discounts, offers, signature images, etc.
6. Sensitivity analysis
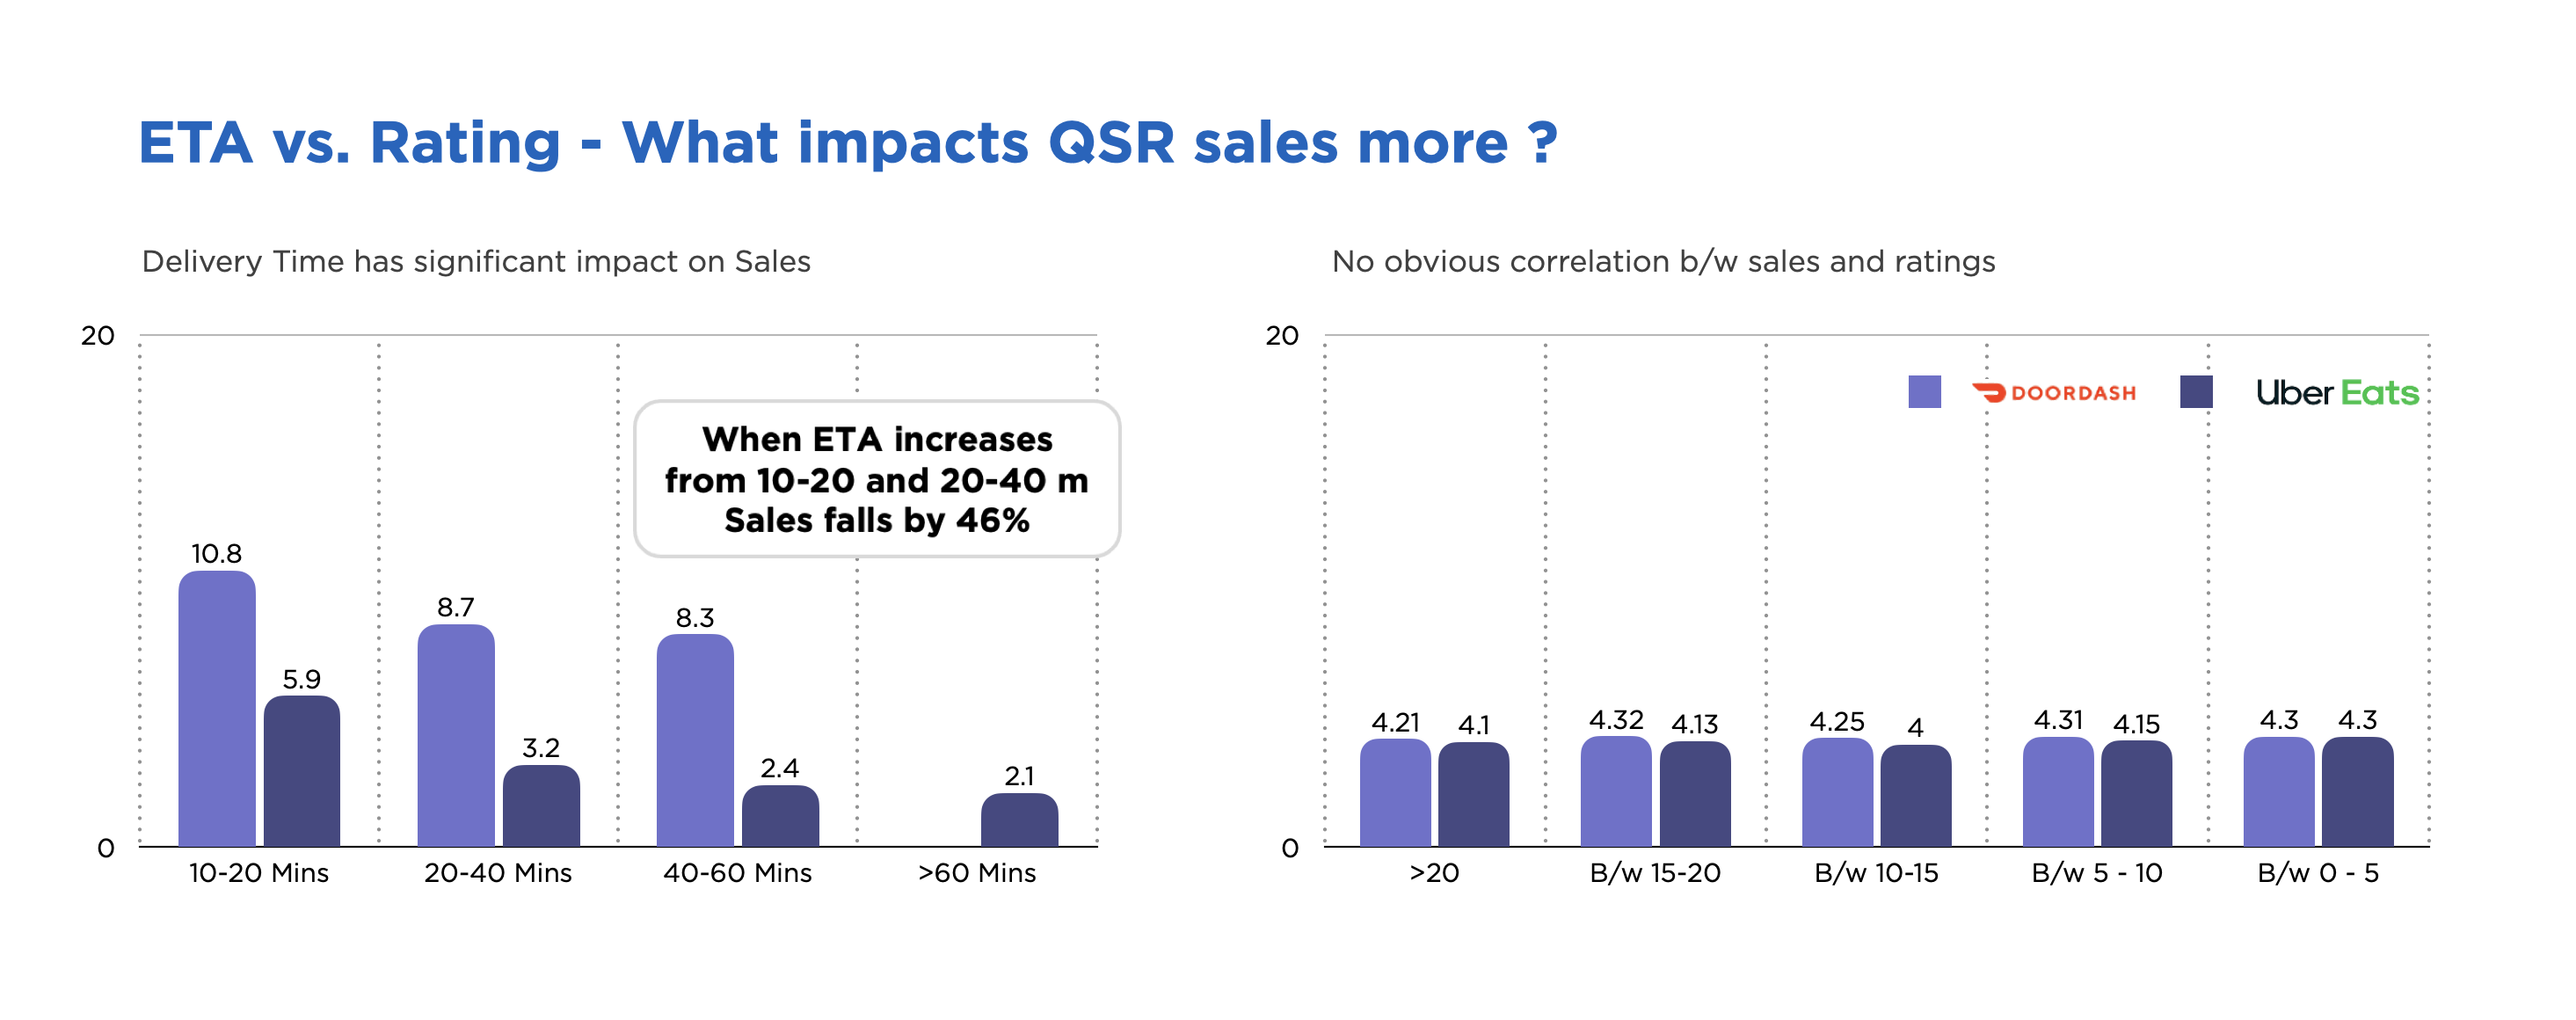
- What has more impact on sales – Ratings or ETAs?
- What will be the likely impact on sales of the marketing campaign in New York vs. Denver?
- What is the likely impact of competitors’ ad blitz on your sales?
Data can answer these and many more questions, and this sensitivity analysis should be part of the QSR chain’s decision-making
7. Monitoring campaign performance
QSR chains spend millions of dollars of ad budget running campaigns on aggregator platforms combining banner ads, discounts, offers, etc.
It’s a great idea to measure QSRs rank on these aggregator’s platforms before, during, and post the campaign in focus Zip Codes for priority keywords to see if the gain in ranking is temporary or lasts for a while.
The ultimate factors for QSRs to win will remain the quality of food and consistency of the brand’s messaging. Leveraging the power of data can help understand the aggregator platform’s characteristics, competitor’s strengths, weaknesses, & strategy, and consumer behavior trends.
Also, data can help better direct ad dollars and the eCommerce teams’ focus on the right initiatives to drive maximum sales and growth.
DataWeave for QSRs
DataWeave has been working with global QSR chains, helping them drive their growth on aggregator platforms by enabling them to monitor their key metrics, diagnose improvement areas, recommend action, and measure interventions’ impact.
DataWeave’s strategy eliminates the dependence on food apps for accurate data. We directly crawl food aggregators apps and websites and help you with data and analysis to solve the aforementioned issues and drive 10-15% growth.
Thank you for Subscribing - Team DataWeave
Book a Demo
Login
For accounts configured with Google ID, use Google login on top. For accounts using SSO Services, use the button marked "Single Sign-on".